graph and trends...

General HouseBot discussion. Any issues that don't fit into any of the other topics belong here.
Richard Naninck
HouseBot Guru Extraordinaire
Posts: 1121
Joined: Tue Sep 28, 2004 7:49 am
Location: The Netherlands

Re: graph and trends...

Post by Richard Naninck »

Here is your basic log sub. taylor it to your needs...

Code: Select all

'-------------------------------------------------------
'- Write Log Line --------------------------------------
'-------------------------------------------------------
Sub WriteLog(strLogFlag, strLogLine)
Dim FileSystem
Dim StdOut
Dim FileName
Dim AlarmLog
Dim LogLines
Dim LogCount
Dim nit

	On Error Resume Next
	If strLogFlag = "On" Then

		AlarmLog = GetPropertyValue("Alarm Status.Log")

		If AlarmLog = "No items present" Then
			AlarmLog = ""
		End If

		LogLines = Split(AlarmLog, vbLF)
		LogCount = UBound(LogLines)
		AlarmLog = "*S-" & vbTAB & GetPropertyValue("System Time.TimeAndDate") & "  " & strLogLine

		If LogCount > 300 Then
			LogCount = 300
		End If
		
		For nit = 0 to LogCount
			LogLines(nit) = Replace(LogLines(nit), "*S-", "")
			AlarmLog      = AlarmLog & vbLF & LogLines(nit)
		Next

		SetPropertyValue "Alarm Status.Log", AlarmLog
		Sleep 150 'Keep this Sleep here to prevent LogLines to be overwritten because of delay between HouseBot and script

		If GetPropertyValue("Alarm Status.Log Switch File") = "On" Then
			FileName       = GetPropertyValue("Alarm Status.Log File Path")
			Set FileSystem = CreateObject("Scripting.FileSystemObject")	
			Set StdOut     = FileSystem.OpenTextFile(FileName, 8, True)
                	
			If Err.Number = 0 Then
				StdOut.Write Date & " - " & Time & " - " & strLogLine & vbCRLF
				StdOut.Close
			Else
				Status = Err.Description
				Err.Clear
			End If
                	
			Set StdOut     = Nothing
			Set FileSystem = Nothing
		End If
	End If
	strLogLine = ""
End Sub
Osler
HouseBot Guru
Posts: 742
Joined: Fri Feb 03, 2006 11:18 pm

Gnuplot Plugin

Post by Osler »

I have HouseBot piping commands to gnuplot using stdin in a plugin. Details about how a graph should look can be set using property values within HB (colors, line size, labels, key, png size, etc.). Before I get it wrapped up, I wanted to ask for input on usage from users interested in graphing charts and trends.

I envisioned it as graphing only time series data, so that is currently hard coded into the plugin. Is there any reason you would want to graph data that is not time series?

I had originally planned to have a single device and then have a task tell the device where input data files reside, having one device create multiple graphs. However, after playing with it last night, I could see how you may want to set it up such that a charting device creates the same graph at a set interval as well, having a device for each graph you want to make. Any thoughts?

How many graphs would you want to overlay at a time? It is currently coded to allow 3 sets of data to be plotted on the same chart (i.e., inside temp, outside temp, HVAC runtime). Does anyone have the need to plot more than 3 things on the same chart?

Osler
raptor_demon
Senior Member
Posts: 141
Joined: Tue Jul 07, 2009 12:55 pm
Location: NC

Re: graph and trends...

Post by raptor_demon »

Hi,

this would be awesome, i would like to be able to plot 15 on one so i can have all my sensors on one graph,

Would this be possible?

Raptor
Osler
HouseBot Guru
Posts: 742
Joined: Fri Feb 03, 2006 11:18 pm

Re: graph and trends...

Post by Osler »

Wow...that would be a lot of property values to keep track of. What about the other questions I posed?

Osler
raptor_demon
Senior Member
Posts: 141
Joined: Tue Jul 07, 2009 12:55 pm
Location: NC

Re: graph and trends...

Post by raptor_demon »

Thanks Osler,

I think one device per graph would be easier to setup.

As for the other question it would be nice to maybe have a differnt type of device that let you do a device on the X axis and the count of triggers on the Y axis.

An example might be number of pulses from a water meter, gas and electricity as a bar graph. I have no use for this yet but down the road it might be very useful.

So yes i think it would be good to do something other than over time.

Raptor
Osler
HouseBot Guru
Posts: 742
Joined: Fri Feb 03, 2006 11:18 pm

Re: graph and trends...

Post by Osler »

I'll take a look at making it a bit more generic for any x and y.

I think for the more complex graphing I can allow you to build a gnuplot script and then load it. This way the device itself would be relatively simple, but if you wanted to go hog wild with 15 overlayed plots you could write the gnuplot instructions in a text file and then load it into gnuplot via the HouseBot device.

Osler
edgar
Member
Posts: 95
Joined: Tue Mar 24, 2009 11:14 pm
Location: Springfield, VA

Re: graph and trends...

Post by edgar »

Hi Osler,

This is GREAT!
I have been looking at GNUPlot for a while, just have not have had the time to delve into it. I am currently doing some statistics stuff ...creating graphs automatically. I am using a simple program I found on the web that a guy uses with HAL2000 to create graphs called 'Autograph'. While it was not the most versatile tool (build for HAL2000), it worked for me. Below is an example of the data file it needs to have as an input. Not being a programmer (at least not a good one), I took my Housebot log file and parsed it to look like the below using an autohotkey script. Then I run the graphing program (can be run from the command line) on the data files. The attached image file is what you get (not very flexible on the display). One thing I like about this little program is that while the X axis was time, the Y axis indicated how long a device was in a particular state. The program can also graph values, but I like the 'runtime' as you mentioned in an earlier post very much for things like the attached example- I wanted to see how long my front door was opened each day (Housebot is integrated to my DSC security system).

I am excited about what you are working on with GNUPlot--that is awesome! To focus on your questions, and having played with this type of thing a bit, I have not yet found anything that would NOT be plotted on an X time axis (of course does not mean there would never be anything of course). I think the real focus is the Y axis and being able to capture 'values' and 'runtime' or time in a given state as my example shows is key.

I would suggest keeping it simple to start (maybe limit to 3 or four pieces of data as you suggest). At least for us non programmers to get it running :) Also, being able to adjust the look and feel of the graph (line, bar, colors, legend) would be nice features.

data file i currently use:
11/19/2009 01:03:31 PM -- OFF
11/19/2009 01:04:50 PM -- ON
11/19/2009 01:17:07 PM -- OFF
11/19/2009 01:33:38 PM -- ON
11/19/2009 01:33:45 PM -- OFF
11/19/2009 01:41:47 PM -- ON
11/19/2009 01:41:51 PM -- OFF
11/19/2009 01:58:54 PM -- ON
11/19/2009 01:59:03 PM -- OFF
11/19/2009 02:00:55 PM -- ON
11/19/2009 02:01:02 PM -- OFF
11/19/2009 02:02:16 PM -- ON
11/19/2009 02:02:22 PM -- OFF
and so on...........

v/r

Kevin
Attachments
Front Door Activity
Front Door Activity
FrontDoor 11-19-2009.jpg (37.13 KiB) Viewed 4127 times
Osler
HouseBot Guru
Posts: 742
Joined: Fri Feb 03, 2006 11:18 pm

Re: graph and trends...

Post by Osler »

The data format you presented is exactly what is required for gnuplot. A simple text file with the data in column format separated by white space (space or tab). There could be multiple columns of data such that:

Code: Select all

#A sample gnuplot data file where columns are as follows:
#Timestamp          Outside Temperature     Inside Temperature
Mar-22-12:00:00    95.4                             72.3
Mar-22-12:01:00    95.2                             71.1
....
From such a file, you can tell gnuplot which columns to graph. These will need to be generated outside of the device, likely via a script. However, it may be interesting to have the device be a logging/graphing device, meaning that you can assign it property values to log to a text file at set intervals and then create a graph once the logging is complete.

I haven't dug to far into histograms at this point. They can be done, but I am working on getting line plots down to start. I will try to get a simple graphing device out be weeks end that will allow 4 plots on the same graph via an input file as above. I will also try to incorporate using a .gnu file (basically a script that tells gnuplot where to get the data and how to graph it), which would function independent of property value settings for the device.

Osler
wallebalboa
Senior Member
Posts: 111
Joined: Wed Aug 11, 2004 6:52 pm
Location: Sweden

Re: graph and trends...

Post by wallebalboa »

Hi...
After i posted this for some years ago ;) i found a free (donate!) package for graphing (http://www.MSure.se). I also (tnx to Edward) started to go the xAP path.
MSure is based on a SQL db and have a very flexible way of Graphing with xml configurations. it polls 1-wire devises and create graphs, publish devices and graphs on xAP and with the xAP plug its easy to get these in to Housebot. I log xAP events in msure and plot them...

nice things to have on top of this would be if HB could log in SQL direct when checking the log checkbox... and a easy way to let list device present SQL results in HB...
never 100% satisfied ;)

The msure forum is mixed swedish and english but if you see any intresting .. just ask in english and you will get a english answer...


A typical graph for temp is attached (i use green as transparent...). its no problem to log lots of values in in same graph... (as you see its still cold in sweden ... ;s )
Attachments
tempnock7days.png
tempnock7days.png (26.93 KiB) Viewed 4122 times
raptor_demon
Senior Member
Posts: 141
Joined: Tue Jul 07, 2009 12:55 pm
Location: NC

Re: graph and trends...

Post by raptor_demon »

Hi Osler,

Just wondering if you had any luck with the graphing script?

thanks

raptor
Osler
HouseBot Guru
Posts: 742
Joined: Fri Feb 03, 2006 11:18 pm

Re: graph and trends...

Post by Osler »

My plugin development is on hold. See the plugin forum for an explanation.

Osler
raptor_demon
Senior Member
Posts: 141
Joined: Tue Jul 07, 2009 12:55 pm
Location: NC

Re: graph and trends...

Post by raptor_demon »

Osler,

I am sorry to hear you are unable to proceed with any scripting.

Thanks for your help

Raptor
raptor_demon
Senior Member
Posts: 141
Joined: Tue Jul 07, 2009 12:55 pm
Location: NC

Re: graph and trends...

Post by raptor_demon »

Ok!

Witht he help of everyone here i got my graphing working !!


I will post the scripts later today.

thanks everyone

Raptor
edgar
Member
Posts: 95
Joined: Tue Mar 24, 2009 11:14 pm
Location: Springfield, VA

Re: graph and trends...

Post by edgar »

raptor,

Thanks for working on this. I spent the weekend with gnuplot and autohotkey to work on revising my graph building....not as far along it seems you are..looking forward to checking out what you put together.

v/r

Kevin
raptor_demon
Senior Member
Posts: 141
Joined: Tue Jul 07, 2009 12:55 pm
Location: NC

Re: graph and trends...

Post by raptor_demon »

Ok, here is how i did it. its not perfect but its close.


First off you need an object called Alarm Status that looks like this:
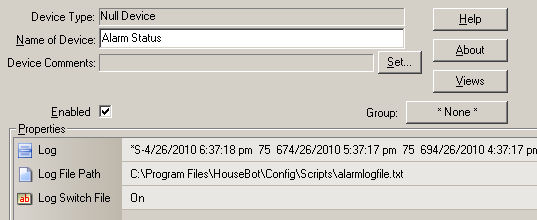
Alarm Status object
Alarm Status object
Alarm status.jpg (33.75 KiB) Viewed 4025 times
This stores an alpha list with the variables in it, the file path and the flag to choose if to log to the file or not.

Here is a modified version of Richard's script. I added the preface to allow it to be run as a task. I also modified the output to support 2 variables and removed some of the dashes in the file.

Code: Select all

Option Explicit
Dim CurTemp 'this is the inside temp from thermostat
Dim OutTemp ' this is the outside temp from weather device
CurTemp = GetPropertyValue("Thermostat 1.Current Temperature")
OutTemp= GetPropertyValue("Weather.Current Temperature")

if len(OutTemp) > 4 then ' this is to trim out the °F
OutTemp=Left(OutTemp,3) 
else
OutTemp=Left(OutTemp,2) 
end if

Call WriteLog("On",CurTemp,OutTemp) 'call writelog with the 2 variables above


'-------------------------------------------------------
'- Write Log Line --------------------------------------
' Written by R N 
' usage writelog(write to file?,var1,var2)
'-------------------------------------------------------
Sub WriteLog(strLogFlag, strLogLine,strLogLine2)
Dim FileSystem
Dim StdOut
Dim FileName
Dim AlarmLog
Dim LogLines
Dim LogCount
Dim nit

   On Error Resume Next
   If strLogFlag = "On" Then // are we logging to file? 

      AlarmLog = GetPropertyValue("Alarm Status.Log")

      If AlarmLog = "No items present" Then
         AlarmLog = ""
      End If

      LogLines = Split(AlarmLog, vbLF)
      LogCount = UBound(LogLines)
      AlarmLog = "*S-" & vbTAB & GetPropertyValue("System Time.TimeAndDate") & "  " & strLogLine & "  " & strLogLine2 'write to alphalist

      If LogCount > 300 Then
         LogCount = 300
      End If
      
      For nit = 0 to LogCount
         LogLines(nit) = Replace(LogLines(nit), "*S-", "")
         AlarmLog      = AlarmLog & vbLF & LogLines(nit)
      Next

      SetPropertyValue "Alarm Status.Log", AlarmLog
      Sleep 150 'Keep this Sleep here to prevent LogLines to be overwritten because of delay between HouseBot and script

      If GetPropertyValue("Alarm Status.Log Switch File") = "On" Then
         FileName       = GetPropertyValue("Alarm Status.Log File Path")
         Set FileSystem = CreateObject("Scripting.FileSystemObject")   
         Set StdOut     = FileSystem.OpenTextFile(FileName, 8, True)
                   
         If Err.Number = 0 Then
            StdOut.Write Date & " " & FormatDateTime(Time,4) & " " & strLogLine & " " & strLogLine2& vbCRLF 'here is where we write the variables to a file
            StdOut.Close
         Else
            Status = Err.Description
            Err.Clear
         End If
                   
         Set StdOut     = Nothing
         Set FileSystem = Nothing
      End If
   End If
   strLogLine = ""
End Sub

the script is run from a task which runs once an hour and updates 2 dynamic images to allow viewing on SWremotes.


this is a sample of the file:
4/24/2010 01:37 75 72
4/24/2010 02:37 75 72
4/24/2010 03:37 75 72
4/24/2010 04:37 75 72
4/24/2010 05:37 75 72
4/24/2010 06:37 74 72
4/24/2010 07:37 74 72
4/24/2010 08:37 74 72
4/24/2010 08:48 74 72
4/24/2010 09:37 74 72
4/24/2010 10:37 74 72
4/24/2010 11:37 74 72
4/24/2010 12:27 75 72
4/24/2010 12:37 75 72
4/24/2010 13:37 76 74
4/24/2010 14:37 77 71
4/24/2010 15:37 75 71
4/24/2010 16:37 75 69
4/24/2010 17:37 75 66
4/24/2010 18:37 77 64
4/24/2010 19:37 77 63
4/24/2010 20:37 76 61

what is important is GNUPLOT needs the columns seperated by spaces and the time and date format needs to be exact.

Lets look at the GNUPLOT part.
task.zip
Support files
(204.6 KiB) Downloaded 250 times
the following files need to be placed in the c:\program files\gnuplot\binary folder.
buildgraph.plt and buildgraph.bat
The bat file copies the alarmlog.txt file from the housebot dir to the gnuplot binary dir then copy the 2 output png's to my theme dir.
the plt file is preset to do a dual line graph with outside and inside temps.


This should be the result:
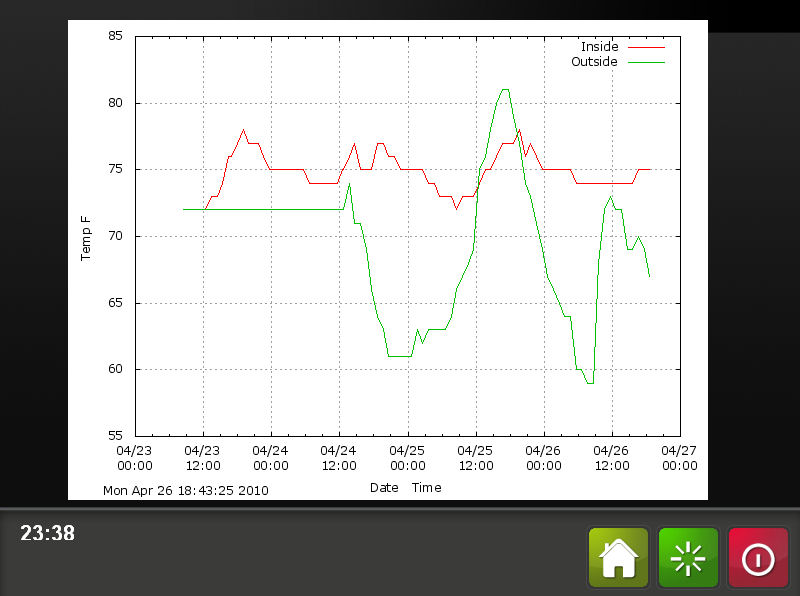
Result
Result
webdt.jpg (73.8 KiB) Viewed 4025 times

I hope this is clear and helps,

Most of the code belongs to others on this site.

This can be expanded to more variables to graph as needed. I am still trying to work out how to style the graph better so it fits in with my theme.

Let me know if you have any questions.

Thanks to everyone for helping me get this far.

Raptor
Post Reply